If you’re anything like us, you’ve been doing some spring decluttering this month. For our team, it’s clothes we have (finally) accepted will never fit, toys our children have outgrown, kitchen gadgets collecting dust in our cupboards, and books…so many books!
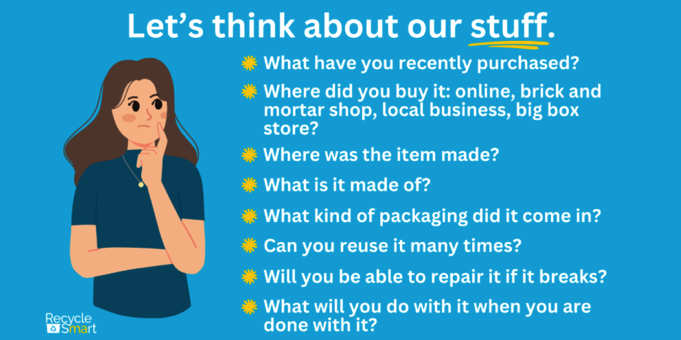
We don’t know about you, but all of our stuff has us wondering: are we thinking about our “stuff” enough? The answer is: probably not. So, let’s do it! Let’s take a minute to think about our stuff.
Why is this important? Because all the answers to those questions are tied to the carbon footprint of the products we purchase. At every step of a product’s lifecycle – from extracting raw materials, to manufacturing and transportation, to what happens to something at the end of its useful life – there are environmental impacts we should all be thinking about. By making the effort to think about where our stuff comes from and where it goes, we can start making more educated decisions about what we buy, and what we do with it.
Over the next few months, we are going to dive deep into waste reduction and why it matters. We’re starting with the subject of trash because that’s our sweet spot, but in the next couple of newsletters, we’ll discuss the climate impacts of what happens “upstream” (before we get our products), as well as the concept of circularity and how the waste hierarchy framework supports it.
Today, our focus is “downstream,” which is what happens to our stuff once we’re done with it. Let’s get started.
HOW MUCH OF OUR “STUFF” ENDS UP IN THE TRASH?
In 2022, the average household in Massachusetts threw away about 1,383 pounds of trash (down from 1,502 in 2021 – hooray!).

The heat map above indicates which communities have higher and lower trash levels based on an annual solid waste survey conducted by the MA Department of Environmental Protection. The green-shaded communities are throwing away less trash, while the dark red and magenta-shaded communities are throwing away the most trash per household.
Why the difference? A lot of it has to do with waste reduction strategies taking place in the green-shaded communities that help residents keep things out of the trash. With things like robust recycling outreach, frequent leaf and yard waste collection, convenient textile recovery bins, collecting hard-to-recycle materials, pay-as-you-throw programs (where residents pay per bag or cart of trash they generate), food scrap collection programs, and so much more, many Massachusetts municipalities are successfully improving their waste management.

We love this graphic. It was created by Lynn Pledger, a tireless waste reduction advocate, back in 2010. The numbers have been updated using the MassDEP’s 2022 Waste Characterization Study, which breaks down the types of things found in our trash.
IT’S NOT WASTE UNTIL IT’S WASTED
Trash is defined as anything worthless, useless, or discarded. But would you believe that more than half of what we trash has value? That’s a LOT of wasted opportunity because so much of what we put in the trash could have been reduced, reused, recycled, composted, or sent for anaerobic digestion!
Let’s take another look at the data with this handy pie chart.

The pie slices highlighted in blue show some of the easier materials to keep out of the trash. You know how we mentioned that much of our waste could be reduced? We were talking specifically about food waste. Nearly 22% of what we throw away is wasted food! The remainder of organic material in the trash is leaf and yard waste. The other two slices represent highly recyclable materials: paper and cardboard, and metals including aluminum and tin. Despite access to recycling programs, we’re still throwing a lot of good stuff away.
You may wonder why plastics aren’t included in the blue section. That’s because the plastics category includes not just plastics that CAN be recycled (bottles, jars, jugs, and tubs) but a LOT of plastics that can’t easily be recycled right now (things like plastic film, bulky rigid plastic, Styrofoam, etc.). We have work to do when it comes to recycling the right kinds of plastics but the category isn’t as straightforward as paper, metal, and organic material.
WHERE DOES IT ALL GO?
Most of our trash goes to five municipal waste combustion facilities in Massachusetts. These facilities burn trash at a very high temperature (approximately 2,500°F) and produce energy for neighboring residents. The combustion process shrinks waste 90% by volume and 75% by weight, so significantly less needs to be buried in landfills. (The by-product of combustion is ash, which must be sent to ash landfills.)
The rest of our trash goes to in-state landfills or is transported to other states by rail or truck. Here’s the rub: our remaining in-state landfills are nearing capacity and could close within the next 10 years, depending on how quickly they fill up. The more waste we divert from our landfills, the longer they can remain open.
The five waste combustors in MA are operating at full capacity right now and there’s no new in-state disposal space in the pipeline. That’s because there is a moratorium on building new waste combustors, and there are no communities raising their hands to provide land and resources for a new landfill. Our limited in-state disposal capacity is just one reason to reduce waste as much as we can.
LOOKING UPSTREAM

We spend a lot of time thinking about what happens to our stuff downstream, but there is so much more to think about. The downstream processes that deal with our waste – recycling, landfilling, combustion, and composting – are extremely important, but they only deal with the end of a product’s life. The greater environmental impacts of our stuff actually occur upstream, before products reach us.
In our next newsletter, we’ll define the idea of “upstream,” explain the connection between our stuff and climate change, and talk about all the ways the State of MA is working to reduce our waste.
The post was reprinted from the RecycleSmart website.


Recently on Twitter